Zener Card Diary March 22, 2020.
I did a session last night (Mach 21, 2020), and this diary entry will discuss that data in context will the other sessions. I can see some challenges in my data when it comes to dates. I publish these articles the day after I do the tests. So, from now on these diary entries will be more explicit to reference the date of the tests. The diary date will reflect the date of publication on my website.
Besides that, I have good news. I saw something new in the current data from the session on the 21st.
Patterns in the Ivy
Much like how you can watch Ivy grow and see natural patterns, I am watching the patterns grow in this data. I will take this moment to mention that my music training is coming in handy. The patterns appear as the patterns of musical forms. For those schooled in music, you will be familiar with patterns like ABABCBA.
The pattern I see right now is that the hit percentage spikes appear commonly in groups of four.
In the two most recent sessions (March 19th and 21st) I performed 12 tests in sequence with 65 cards. In those tests, the first or last test of a group of four had high hit percentages. After the first two groups of four, the pattern breaks down.
Below are the data graphs for each mentioned session.
Note: I am including the graphs from the 17th and the 18th because this is where I first noticed the patterns. Take note that the session on the 17th has the deck size changing. Even with that difference, the pattern is still visible.
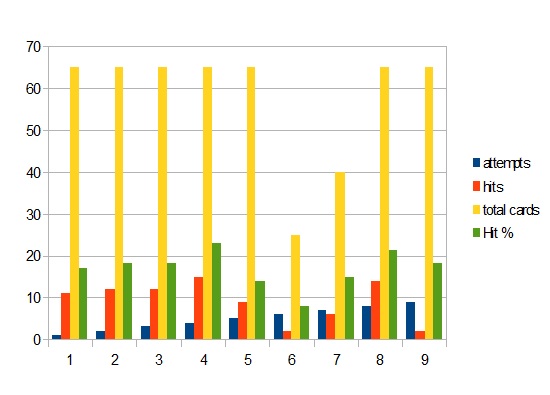
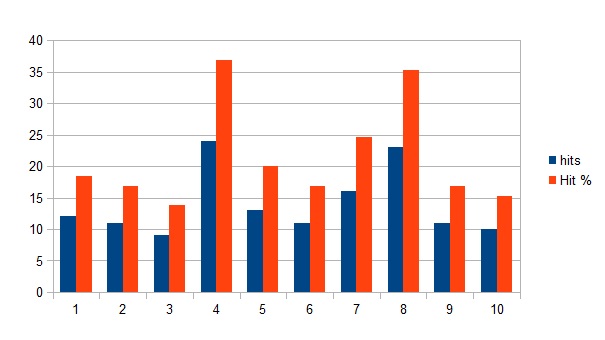
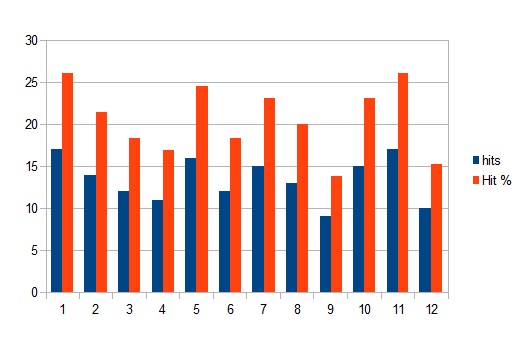
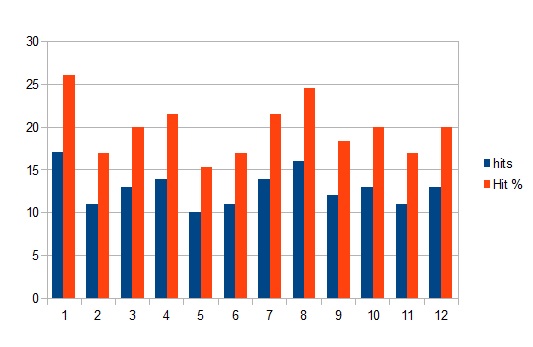
You can see that with these data graphs the session on the 17th and 18th reveals the potential pattern. The session on the 19th with 12 tests has the pattern reversed. The following test on the 21st has the pattern in variation.
Chasing Patterns
When I think of arranging music by sections I see this in the data: AA. BB. BA. I would expect next to see AB, but I don’t think I will. It seems every prediction becomes the opposite. I predicted AA then saw BB. Who knows what will happen on the next test.
What I predict is that whatever hypothesis I make from the data I will see the opposite.
This is all I have for the moment. I will attempt an analysis of all the data in the next entry, if it makes sense to. From here on out, I will be more rigorous with the data and have exact times and dates for the test.
Missed the first article, read it here:
Read the next entry here:

