Zener Card Diary March 18, 2020
This is the second entry of my Zener Card Diary. I am calling it a diary instead of a journal. I already made the graphic for it and that’s that. I like the word diary because it has connotations towards the Ozzy Osborne album Diary of a Madman. I think it is appropriate. Great album, check it out.
Last night, on the 17th, I did another experiment by myself without live streaming. This time I devised a new way to test myself with my bootstrapped Zener deck. I had realized that the first entry in this diary revealed the challenges of testing yourself, and now I may have a solution for that.
New Test
What I did was organize the French Tarot deck into 13 cards of each suit and trump. I left the aces and the number one trump out. The deck had 13 cards for each of the five symbols. I used the 2 all the way up to the four court cards in each suit, and 13 trumps. That gave me 65 cards to test with.
I took the aces and the number one trump and made a spot for them on the table. Then to guess the card, I placed each card into a pile in front of either the heart, club, diamond, spade, or trump. After I had placed all the cards I checked the piles. I would count how many hits I got from each pile and added them up. This test takes a few minutes to complete.
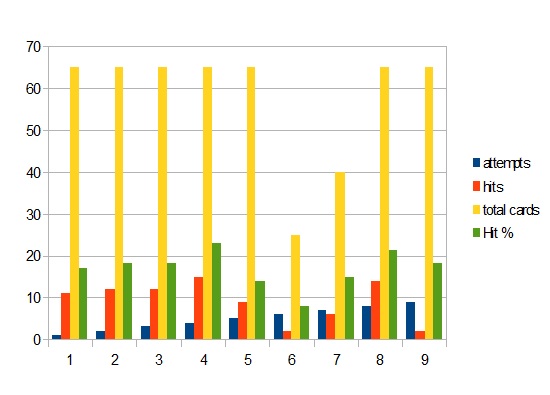
In the first four attempts, I was able to increase my hits from 11 to 15. On the fifth attempt, I scored 9. I took that as a sign to change the method a little bit.
I decreased the number of cards back to 25 and then I set aside 40 cards. I shuffled both sets of cards. I tested my self in the same way with only 25 cards and I got 2 hits. I used the deck with 40 cards and I got 6 hits.
I thought that to be interesting. I went back to 65 cards and got 14 hits and then 12 hits. I did a total of 9 tests.
I am not certain the data can tell us anything yet. So far placing the cards into piles is a good way to test myself. I can’t determine previous answers very well because I can’t visualize the piles clearly. I can at the beginning, but once you start laying out the cards it becomes difficult to tell.
Here is a quick graph that shows the data for all 9 tests.

I am not sure the graph tells us anything yet. It would have been best to stay with 65 cards to see what else happened. But again, this entry reflects me playing around with a new method. The excel file I have now and the graph I made will do well to represent the data I collect in the future.
For the next test session, I will do a set of 10 individual tests. Good thing I like handling cards. I will still use 65 cards because that seems to be the sweet spot for this test. I can also use 25 or 40 if I want to. So far the results have been interesting. I am excited to do the next series of tests soon.
Read the next entry here:


